Demystifying the Kubernetes Iceberg: Part 6
Categories:
14 minute read
This is the sixth article of the “Demystifying the Kubernetes Iceberg” series. My goal for this series is to explain all concepts mentioned in the “Kubernetes Iceberg” diagram by Flant.
This is the iceberg:
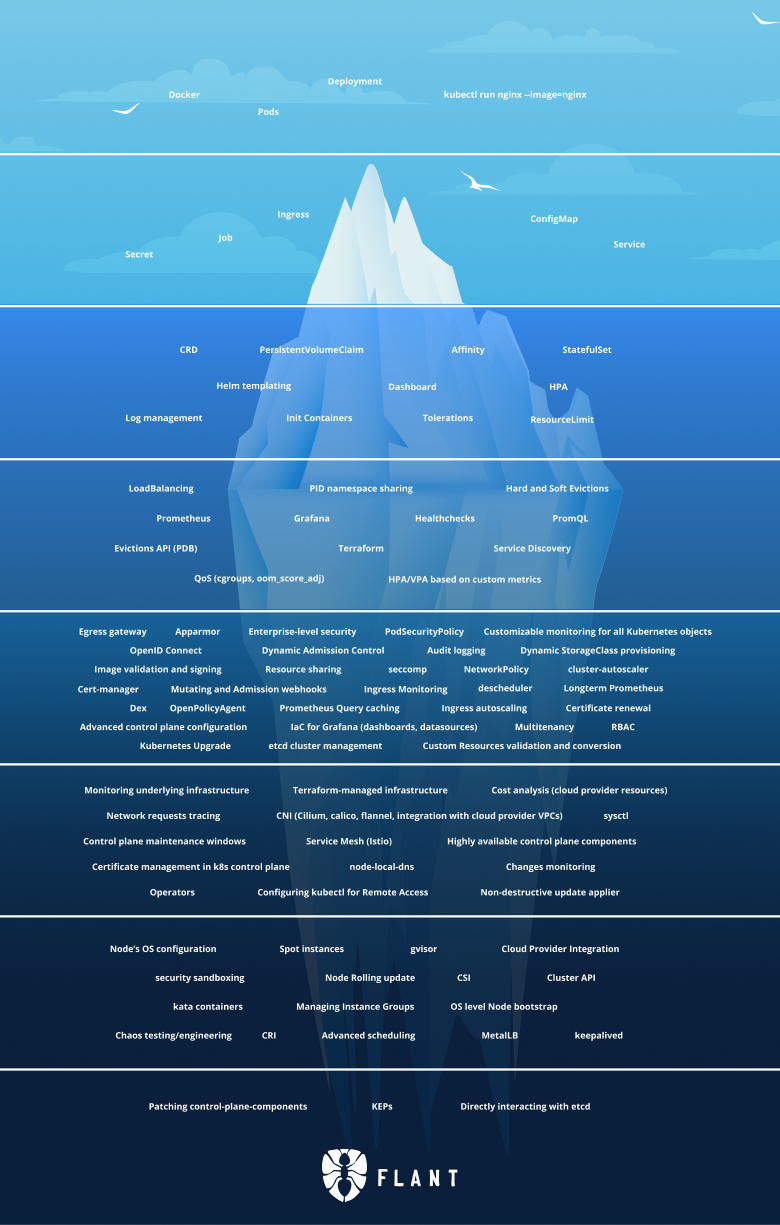
In this article, we will continue with Tier 6 of the iceberg.
This article is a week late, because last week I attended OSCAL 2022 at Tirana, Albania and did not have time to write.
You can find the others articles here:
I will publish one article each week until I complete the whole iceberg.
Tier 6
Monitoring underlying infrastructure
Even if you are deploying your application into a Kubernetes cluster, you still need to care about the underlying infrastructure hosting this cluster. Usually, that would be a set of either virtual machines or bare-metal hosts.
The metrics that you need to care about are the same ones that you would monitor if you were not using Kubernetes:
- machine health
- CPU
- memory
- disk I/O
On top of that, you can add the Kubernetes and container-specific metrics:
- CPU per container
- memory per container
- disk I/O per container
- number of running pods and pod state
- numbers of running nodes and their statuses
A lot of the Kubernetes-specific metrics will be provided to you by the kube-state-metrics component.
In contrast, the non-Kubernetes-specific ones must be provided by the infrastructure provider.
That can be the cloud provider who provided the underlying machines or if you are running on-prem - the management software you use to manage your machines.
For more info and good practices about metrics, you can check this great article by Datadog.
Terraform-managed infrastructure
Terraform is an open-source IaC tool. It allows you to describe your infrastructure in text files and have it created for you by Terraform. Each change in your infrastructure goes through a change in the Terraform files.
You can use Terraform to provision a Kubernetes cluster in any of the major cloud providers (e.g., AWS, Azure, GCP, etc.) via the Terraform providers for that cloud.
You can also use Terraform to provision the underlying infrastructure (virtual machines) and use that to spin up your own Kubernetes clusters (for example, via kubeadm).
The latter is less common because if you already use a cloud provider to manage your infrastructure, why not use the complete package and let it manage your Kubernetes clusters. But it has its use-cases, for example, if you are running multi-cloud and want to provision VMs in many clouds but then create clusters on top of them in a unified manner.
Cost analysis (cloud provider resources)
Cost analysis is an important topic in today’s world, where many of our workloads are running in public clouds (like AWS), where we are billed by the hour.
We are often over-provisioning infrastructure and are paying for more than we are using. There are many reasons for this. If you are a well-funded early-stage startup, your main goal is to build a good product as quickly as possible and reach a product-market fit. In this case, you usually don’t care about your cloud provider bill. Another reason is that the people using the infra are not paying for it, so when they create yet another Kubernetes cluster or yet another virtual machine, they don’t realize (or don’t care) about the cost implications to the company. Also, developers are often lazy and forget to stop a VM or down-scale.
That is why there are a lot of companies focused on building product that helps you measure your cloud bill and find ways to reduce it.
Such are Kubecost, CloudZero and native ones provided by your cloud provider (AWS Cost Explorer, Microsoft Cost Management, GCP Cost Management).
CNI (Cilium, Calico, flannel, integration with cloud provider VPCs)
CNI stands for Container Network Interface. The CNI implementation is responsible for managing the Kubernetes networking, e.g., configuring the network, provisioning IPs, and maintaining connectivity between the hosts.
The container runtime communicates with the CNI, so all the configuration is dynamic, changing when pods are created or deleted.
Some CNIs give you additional features, such as Network Policies.
There are different implementations of a CNI. These include (but are not limited to):
Cilium
Cilium is an open-source CNCF incubator project that provides networking, security, and observability powered by eBPF.
It is initially created by Isovalent.
Calico
Calico is a partially open-source project developed and maintained by Tigera.
It supports both Linux and Windows and also non-Kubernetes workloads.
flannel
Flannel is an open-source project that provides Layer 3 networking.
It works by deploying the flanneld daemon on each node and allocating subnets for the nodes.
integration with cloud provider VPCs
When using managed Kubernetes (e.g., EKS, AKS, GKE, etc.), you get the underlying Kubernetes infrastructure managed for you by the cloud provider. You also get the Kubernetes managed for you (installation, upgrade, etc.).
Another thing that the cloud provider can manage for you is the networking side. Cloud providers allow you to create VPCs - Virtual Private Clouds. These are isolated environments that are fully encapsulated, and you have the full power to define the level of visibility of a resource inside a VPC (or the whole VPC) to the outside world. For example, you could create a VPC for your test environment, which is completely hidden from the outside world and only accessible through a jump box or VPN. That way, the only people that can access your test environment are those that have access to the VPC, e.g., your developers, but you would be safe from that leaking to the outside world or being indexed by a search engine.
The same concepts can be applied to a Kubernetes cluster. Cloud providers allow you to have a cluster isolated inside its own VPC so that all the private components (etcd, api server) stay private. Once there, you can take steps to explicitly expose the parts that need to be public (the ingress of your app) via a gateway that is outside of the VPC but has access to it.
AWS also has a CNI plugin whose implementation is tightly coupled to the VPC configuration - https://github.com/aws/amazon-vpc-cni-k8s
sysctl
sysctl is a Linux utility that is used to modify kernel parameters at runtime.
Since most Kubernetes clusters run on Linux nodes, sysctl can be used on those nodes.
One can perform sysctl commands from a Pod. In that case, the commands are split into 2 - safe and unsafe.
Safe commands affect only the Pod and do not affect the other Pods or the node. Unsafe commands can affect the other Pods and the Node.
By default, Kubernetes enables all safe sysctl commands, but the unsafe ones need to be specifically enabled by a cluster admin.
This is done by the --allowed-unsafe-sysctls kubelet flag.
Pod sysctl parameters can be configured via the spec.securityContext.sysctls parameters.
For example, the following Pod spec configures this Pod with the sysctl parameter kernel.shm_rmid_forced set to 0:
apiVersion: v1
kind: Pod
metadata:
  name: sysctl-example
spec:
  securityContext:
    sysctls:
      - name: kernel.shm_rmid_forced
        value: "0"
In this scenario, Kubernetes does not differentiate between safe and unsafe sysctls, so be careful what you set.
If you want to configure sysctls on a node, you would have to do that manually or run a privileged DaemonSet that will set the sysctl parameters for each node.
Control plane maintenance windows
When using managed Kubernetes (e.g., EKS, AKS, GKE, etc.), the cloud provider is responsible for managing the underlying infrastructure, and the cluster itself includes version upgrades.
If you haven’t upgraded your cluster in a while, the cloud provider can do a forced upgrade. For example, this can happen if the cloud provider no longer supports the Kubernetes version you are running, so you need to move to a newer one. Some cloud providers also support auto upgrades to the latest version.
Sometimes the cloud provider lets you define maintenance windows so that this update is not disruptive to your business. For example, if you are a retail business, you might want to set this window to when there are the least number of customers. Or, if your customers are based in Europe, you might want to put the maintenance window during the night in Europe so that your customers are not affected. All of this is business-specific, but you get the point.
You can check the maintenance windows docs for AKS and GKE.
Service Mesh (Istio)
A service mesh is a dedicated infrastructure layer that can be used to transparently add capabilities to your application. These include monitoring, observability, TLS termination, authentication/authorization, load balancing, etc.
This layer stands between your application and your customers. In Kubernetes, it is often implemented as sidecar containers. This means that Kubernetes will create an additional container for each of your existing containers. This container will hold the service mesh logic and serve as both ingress and egress proxy for the actual workload container. That way, you can implement TLS termination there, and your application would not bother with TLS logic, but at the same time, your system will be TLS secure.
Istio
Istio is an open-source implementation of Service mesh. It works by deploying sidecar containers.
It is developed and maintained by Google.
All the logic for the Istio service mesh is configured via CRDs which you apply to your cluster. For example, these 2 CRDs configure A/B testing for a service that has 2 versions with a 60/40 distribution between the versions:
apiVersion: networking.istio.io/v1alpha3
kind: VirtualService
metadata:
  name: test-vs
spec:
  gateways:
    - test-gateway
  hosts:
    - "*"
  http:
    - route:
        - destination:
            host: test-svc
            subset: "v1"
          weight: 60
        - destination:
            host: test-svc
            subset: "v2"
          weight: 40
---
apiVersion: networking.istio.io/v1alpha3
kind: DestinationRule
metadata:
  name: test-destination-rule
spec:
  host: test
  subsets:
    - name: "v1"
      labels:
        version: "v1"
    - name: "v2"
      labels:
        version: "v2"
Another popular implementations of a Service mesh is Linkerd.
Network request tracing
Tracing the network requests coming in and out of your Kubernetes cluster can be a handy thing to do when debugging a network problem. This can be implemented in several ways.
Service meshes
Some service meshes provide you with such tracing capabilities. Since service meshes intercept all traffic coming in and out of a Pod they can easily do that by just logging each request and providing that information to you.
System traces
Kubernetes has native support for request tracing for the API server. If enabled it will emit OpenTelemetry events for each request to the API server.
For more info on how to enable it and use it, check out the docs.
Third-party product
A lot of security products also provide some kind of tracing functionality.
Such is the open-source SysDig Inspect, which combined with the kubectl plugin for tracing allows you to add tracing to your Kubernetes cluster.
Highly available control plane components
A highly available control plane means that the control plane is running across multiple nodes, with each of the control plane components replicated on at least three nodes. This is so that even if a node fails, the other ones would still provide the functionality, and the cluster would not just stop running.
This is how all production-grade clusters should be run. Running just a single control plane node is just asking for trouble. You must be aware that infrastructure can and will fail you, so you must be ready when this happens.
If you are running managed Kubernetes (e.g., EKS, AKS, GKE, etc.) the cloud provider would probably not allow you to create a single node cluster.
If you are managing your own cluster, tools like kubeadm provide you the functionality of setting up a highly-available cluster.
Certificate management in K8s control plane
Most of the internal Kubernetes communication (between the cluster components) is done over HTTPS. This means it requires CA certificates.
By default, Kubernetes will automatically generate self-signed certificates, which will be used for communication between the components.
You can also use your own certificates.
This can be done by configuring the API server not to generate certificates but instead fetch them from a location on disk.
Tools like kubeadm make this configuration easy.
You can find more on how to achieve this in this article.
Other tools like cert-manager provide integration with CA authorities to automatically fetch and generate new certificates when the old ones expire.
node-local-dns
NodeLocal DNS Cache is a DNS cache that aims to reduce the number of times a Pod queries a control plane node to resolve a DNS. With NodeLocal DNS Cache (that runs on each Node as a DaemonSet), the Pods will query the cache for DNS records and only call the API server on a cache miss.
For more information on how to configure it, check out this page.
Changes monitoring
If you want to continuously monitor the changes of your Kubernetes resource, you can do with kubectl by providing the --watch flag.
For example, kubectl get pods --watch will return all Pods in the default namespace, but it will keep the command alive and continue polling the API server. Each time a new pod is created or destroyed, it will output it into the console.
The same behavior can be implemented via the Kubernetes Go library:
watch, err := client.Client.CoreV1().Pods("default").Watch(corev1.ListOptions{})
if err != nil {
  // handle error
}

for event := range watch.ResultChan() {
  // use event
}
This way, you can implement custom dashboards that will help you monitor your Kubernetes cluster.
Operators
An operator is a custom Kubernetes controller that interacts with the Kubernetes API to listen for a given object’s creation/update/deletion and trigger some logic based on this event.
It aims to simplify automation and allow the extensibility of Kubernetes by providing an easy way to implement custom workflows.
Usually, operators are tied to a Custom Resource Definition. Operators would listen for the create/update/deletion of a Custom Resource Definition and trigger a workflow when this event occurs.
There are many use-cases for an operator, but provisioning is the most common. Let’s say we want to write an operator that provisions PostgreSQL databases in our Kubernetes cluster. First, we will need to define a CRD. This CRD will contain the basic configuration of the database that we want to be provisioned for us. Once the CRD is applied, the operator will kick in and provision the DB with the specified parameters. That way, all the PostgreSQL-provisioning-specific logic is encapsulated by the operator, and the only thing we as users care about is specifying the wanted configuration.
Configuring kubectl for Remote Access
kubectl is a command-line tool used to interact with Kubernetes.
It translates CLI commands like kubectl get pods to an HTTP API call to the Kube API server (in this case, GET <api_server_addr>/api/v1/namespaces/default/pods) and outputs the results in the terminal.
kubectl can be used to contact any Kubernetes cluster - local or remote.
kubectl knows which cluster to contact based on the kubeconfig file.
A kubeconfig file is a YAML file containing Kubernetes clusters, their addresses, certificates, etc. a kubeconfig file also shows the currently selected cluster.
To see the currently selected cluster use the kubectl config current-context command.
To see all clusters in your current kubeconfig file, use the kubectl config get-clusters command.
A context is a combination between a cluster and a user.
You can have two contexts for the same cluster but different users.
You can also run a kubectl command against a different kubeconfig file by using the --kubeconfig flag as described here
Non-destructive update applier
After we have created our Kubernetes resource, we often find the need to update them. For example, to change the container image of a Deployment when we release a new version of our application, to reconfigure a Service, etc.
We can easily do that with the kubectl apply command.
For example, we can create our deployment via the kubectl apply -f deployment.yaml command, and later update it via updating the file and again running kubectl apply -f deployment.yaml.
When calculating the difference between the new and the old spec Kubernetes uses the strategic merge patch approach. This means that Kubernetes tries to be non-destructive - to add all new properties that have been added in the new spec without removing any of the old ones.
This means that if you want to remove properties from the object, you have to explicitly set them to null in the new spec, or in the case of arrays, use merge directives.
Summary
This is all for part six.
We are almost at the bottom of the iceberg now. Just two more layers left until we complete it. Thank you for sharing this journey with me.
The series continues with Part 7.
If you don’t want to miss it, you can follow me on Twitter or LinkedIn.