Demystifying the Kubernetes Iceberg: Part 5
Categories:
14 minute read
This is the fifth article of the “Demystifying the Kubernetes Iceberg” series. My goal for this series is to explain all concepts mentioned in the “Kubernetes Iceberg” diagram by Flant.
This is the iceberg:
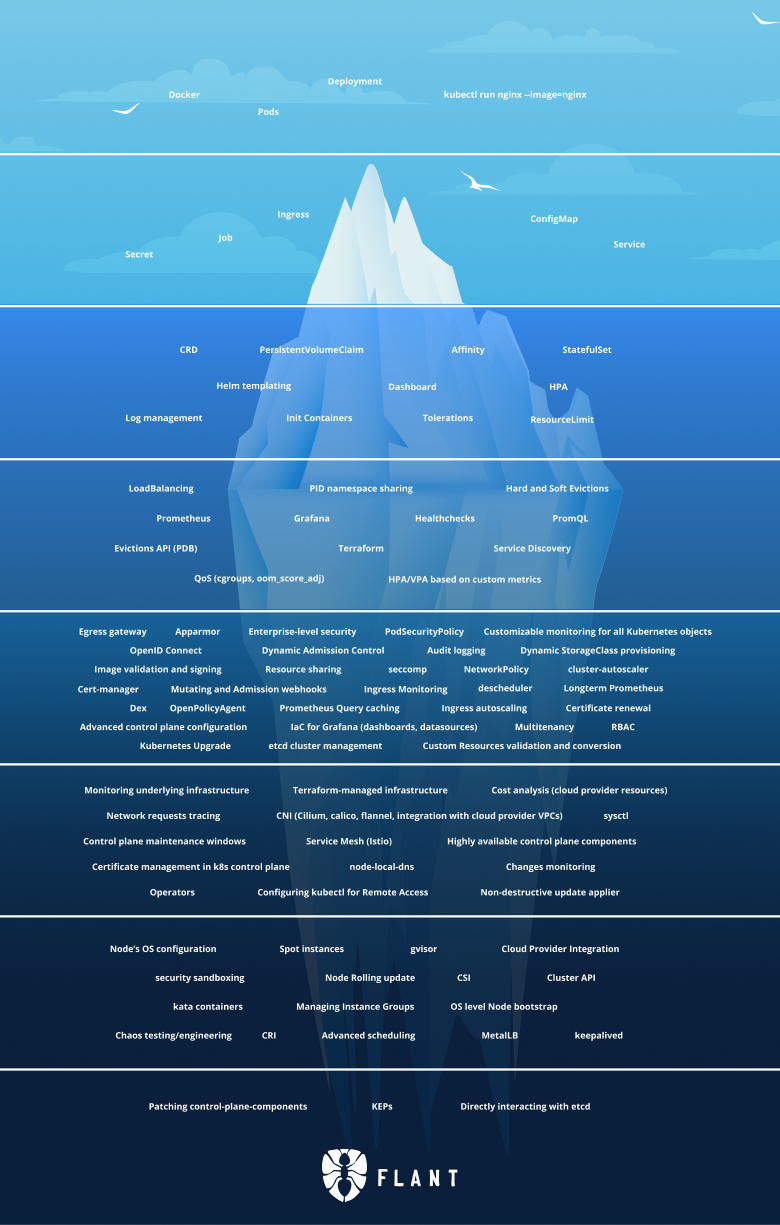
In this article, we will continue with Tier 5 of the iceberg. We started with the first part of Tier 5 last week, and today we will pick up where we left off.
You can find the others articles here:
I will publish one article each week until I complete the whole iceberg.
Tier 5, Part 2
Multitenancy
Multitenancy in Kubernetes is not an easy problem to solve. Part of the reason is that Kubernetes came out from Google, and multitenancy is usually not a necessity in the realm of a single company.
However, people have been trying to do multi-tenant Kubernetes for a while now. There are some solutions and blueprints to how it could be done. I would try to list the main ways to do that, with their pros and cons.
In these examples, we will assume that we are still talking about a single company, and the tenants are different teams inside that company.
Multitenancy with namespaces
One way to do multitenancy in Kubernetes is via namespaces.
Each team(tenant) gets its own namespace. Using RBAC we can assign permissions to the team members for only the namespace of their team.
Pros:
- Easy to do. A new team comes - create a new namespace.
- Does not require any additional software for maintenance.
- Easy for a centralized team to enforce some sets of rules and standards for all teams using this cluster.
Cons:
- Isolation is not ideal.
- User access is regulated via RBAC, but workloads (Pods) can still see other and talk to each other even when in separate namespaces.
- Workloads will also run on a shared infrastructure, so a problem like a memory leak or container escape in one workload can easily affect other tenants’ workloads.
- Some cluster-wide resources (like operators) can conflict with each other because there are many teams but just one cluster, and there can be only one such resource in a cluster.
- Requires additional management
- Since provisioning multiple clusters by hand will become pretty tedious quickly, this solution will almost always require an additional management layer on top of all your Kubernetes clusters. This could be any of the cloud providers (AWS EKS, Azure AKS, GCP) or some self-hosted solution like VMware Tanzu TKG or Rancher.
Multitenancy via different clusters
Another way to do multitenancy in Kubernetes is to… not do multitenancy in Kubernetes. Just provide a different cluster for every tenant.
Pros:
- Good isolation. A problem in one tenant’s workload will not affect other tenants.
- Good autonomy. Each team is the owner of their cluster, and they can do whatever they like.
Cons:
- Expensive. Each cluster has some resource overhead for the master nodes and other system components. With this approach, this cost is multiplied by the number of teams.
- It is harder for a centralized authority to enforce the same set of rules to every cluster in the organization because there will be many clusters.
Multitenancy via virtual clusters
This approach aims to get the best of both worlds. It involves deploying an additional layer that abstracts your namespaces and makes them look like separate clusters from the outside.
An existing solution is the vcluster project by loft.sh.
In short, how it works is that it gives access to a user to a cluster, which is just a namespace in the main cluster. The user can deploy workloads there, but they will never be scheduled because they will actually be scheduled in the main namespace in the main cluster.
That way, it gives the tenants autonomy while still providing an easy way for cluster admins to enforce centralized rules and policies.
Cert-manager
cert-manager is a X.509 certificate controller for Kubernetes.
It can be configured to obtain certificates from public Issuers (such as Let’s Encrypt) or private ones. It is also responsible for keeping the certificates up-to-date, so it will attempt to renew any expiring ones.
Nowadays, using TLS for public connections is mandatory, but it is also recommended even for private service-to-service communication.
cert-manager is a valuable project that can help you a lot in being more secure in that aspect.
Certificate renewal
Certificate renewal is the process of renewing your SSL certificates. This is necessary because each SSL certificate has an expiration date, after which it is not valid.
In the past, certificate issuers used to issue certificates with huge validity periods (5 years, for example). This is now considered a bad practice, and browsers will usually reject certificates with validity bigger than 1 or 2 years.
Let’s Encrypt issues certificates valid only for three months. This is to encourage the use of automation when renewing certificates.
If you are using cert-manager, it can automatically handle the certificate renewal process.
cluster-autoscaler
Kubernetes cluster-autoscaler is a tool that automatically adjusts the size of the cluster (number of nodes) based on several factors, such as node utilization and failing pods.
It makes sure that there is a place for all Pods to run while at the same time it is not using more nodes than it could be.
There is an available implementation for most major cloud providers such as AWS, Azure or an external out-of-tree one.
Egress gateway
Egress gateway is a gateway for the outgoing traffic.
An egress gateway allows you to limit the outgoing traffic of your workloads. This could be a useful security feature for preventing an attacker from making malicious network connections to the outside world.
This is not a native Kubernetes concept, but it is implemented by some Kubernetes network implementations (CNI), such as Calico and Cilium or by service meshes like Istio.
descheduler
The descheduler is a Kubernetes component that is responsible for descheduling workloads.
That can happen for a variety of reasons:
- Some nodes are under or overutilized.
- Taints or labels are added to or removed from nodes, and pod/node affinity requirements are not satisfied anymore.
- Some nodes failed, and their pods moved to other nodes.
- New nodes are added to clusters.
After the descheduler has descheduled the pods, they are back to the scheduler, and it is his responsibility to reschedule them again.
Custom Resources validation and conversion
CustomResourceDefinitions are a way to define custom resources and thus extend the Kubernetes API.
Each Custom Resource Definitions defines its fields via an OpenAPI spec.
For example, a User CRD can have the following API spec:
schema:
  openAPIV3Schema:
    type: object
    properties:
      spec:
        type: object
        properties:
          id:
            type: string
          name:
            type: string
We see that the User has two properties - id and name, both of type string.
The Open API spec of the resource can be extended to specify additional validation for the fields.
For example, you could define required properties via the required parameter or specify a regex validator for the string values via the pattern parameter:
id:
  type: string
  required: true
The validation for these fields will be performed by the Kubernetes API automatically, and if a user tries to create an object that violates these rules, the request will fail.
etcd cluster management
etcd is a distributed key-value store.
By default, Kubernetes uses etcd as the place where all data is persisted.
For example, when we create a Pod resource, that gets persisted into etcd.
Since etcd is by-design, a distributed data store, most production environments run multiple etcd instances.
This way, even if one of them dies, our data will be safe in the other ones.
In order to work together, the etcd instance need to be aware of one another and be able to communicate with each other.
This requires some amount of configuration when starting the cluster.
Most of the important things to know when configuring an etcd cluster, like service discovery, DNS and TLS configuration, etc., are described here.
Finally, a good security measure for etcd is to run it on dedicated master nodes, which are not publicly available, and are configured via Network Policies to be only accessible to the API server.
This is because we should never interact directly with etcd, only through the API server.
Also, if an attacker got access to etcd, they could damage our cluster (for example, by deleting resources.)
Kubernetes Upgrade
Upgrading your Kubernetes cluster is an important thing in the cluster lifecycle. New Minor Kubernetes versions (v1.XX.0) are released every four months, with patch versions (v1.24.XX) released more often to address bugs and security vulnerabilities.
New Kubernetes versions provide new features, and old Kubernetes versions eventually reach End-Of-Life, and support for them is dropped. You should always be running a supported Kubernetes version.
For people running managed Kubernetes (e.g., EKS, AKS, GKE, Rancher, etc.), upgrading your Kubernetes cluster can be as simple as switching a value in a drop-down menu in the cloud-provider UI.
That is not the case, if you are managing your Kubernetes cluster on your own. If so, you would need to upgrade your cluster manually. By “manually,” I mean there is a helpful tool that manages most of the heavy lifting, but you will still be responsible for using it properly.
That tool is called kubeadm and helps not only for upgrading a cluster but also for setting it up.
The process of upgrading a cluster is described in detail here, but the basic steps to follow are these:
- BACKUP your data!
- upgrade your master node one by one
- upgrade your CNI
- upgrade your worker nodes one by one
IaC for Grafana (dashboards, data sources)
IaC stands for Infrastructure as Code. This paradigm involves describing your infrastructure in text files (code) and having a tool that will provision/destroy resources based on the contents of this file and the changes to it. Such tools are Terraform, Pulumi and others.
Most IaC tools like Terraform can provision absolutely everything given that there is a provider for it. A provider is an implementation that provisions infrastructure based on your code.
There is such provider for Grafana. Using it, you can describe your dashboards and data sources as code and get these automatically created for you by your IaC tool.
For example, this is a Terraform code snippet that will create a Grafana dashboard based on the grafana-dashboard.json JSON file:
resource "grafana_dashboard" "metrics" {
  config_json = file("grafana-dashboard.json")
}
It is also possible to manually configure your dashboards by hand and then export the Terraform code for them. This way, you get the best of both worlds - manual configuration maintained by your IaC tool.
Advanced control plane configuration
The Kubernetes control plane and its components (api-server, controller-manager, scheduler, and etcd) support some customization depending on the user’s needs.
This customization is different for each component, but if I have to point out some of the most important things for each one:
API server
- audit log configuration - max size, the place to be stored, retention, etc.
- TLS certificates
- configuration of the leader-elect algorithm
- enabling and disabling optional features
- metrics
Controller manager
- TLS certificates
- configuration of the leader-elect algorithm
- enabling and disabling optional features
- metrics
Scheduler
- TLS certificates
- configuration of the leader-elect algorithm
- enabling and disabling optional features
- metrics
etcd
- TLS certificates
- metrics
- clustering configuration
Customizable monitoring for all Kubernetes objects
Fully monitoring all your Kubernetes objects is vital in order to have complete visibility of the state of your cluster and be able to act accordingly when needed.
Kubernetes provides you with two ways to monitor your resources.
The first one is the resource metrics pipeline, which gives you a limited set of metrics related to cluster components.
They are saved in a short-term in-memory metrics server and exposed via the metrics.k8s.io API or via the kubectl top utility.
The second one is the full metrics pipeline, which is more sophisticated and gives you more metrics to work with.
These are exposed by implementing either of the custom.metrics.k8s.io or external.metrics.k8s.io APIs.
A CNCF-supported implementation of these APIs is Prometheus.
Long-term Prometheus
Prometheus is an open-source monitoring and alerting toolkit.
It is used for metrics collection and aggregation.
It can also be integrated with local or remote file storage to achieve bigger data retention.
The file storage options are configured via the --storage.XXX command line arguments.
When using long-term storage, it is advisable to lower the number of time series scrapes in order to save space (and also because you probably would not care about second-by-second of your 6-month-old metrics).
Prometheus Query Caching
Prometheus queries are written in PromQL.
PromQL is quite powerful and can do many things like summing, averages, aggregation, etc. These are heavy operations that, if executed on a large dataset, can take a significant amount of CPU and memory to complete.
That is why Prometheus front-ends like Grafana (and Prometheus itself) support query caching, e.g., saving the results of a given query for some time, and if another user runs the same query on the same data, it will return the cached results. This speeds up the process of fetching the data and avoids unnecessary computations.
Of course, this is a trade-off because in a real-time system like Prometheus, the data changes by the second, so we cannot set too big a cache TTL without risking showing our users outdated data.
Ingress Monitoring
The ingress manages the external traffic coming into the cluster.
It is an integral part of our system - if the ingress is down or it cannot scale, our whole system will be blocked because all requests go through the ingress before getting into it.
That is why it’s important to have monitoring in place so that we know at any given time what traffic flows into our system, what the latencies are, are there any problems, etc.
Since the Ingress resource is an abstract one, all functionality is implemented by the controllers.
So is the monitoring.
Different ingress controller implementations provide different monitoring constructs, but they all achieve the same results.
For example, if you are running the NGINX Ingress controller, you can enable metrics via the -enable-prometheus-metrics flag, and then you can consume the metrics listed here.
Ingress autoscaling
After enabling ingress metrics, you can take it to the next level and autoscale your ingress based on these metrics. For example, spin up new instances once you have a traffic peak and the network latency starts growing.
It’s vital that your ingress is scaled appropriately because this is the entry point of the traffic to your application. If not scaled correctly, the ingress could be a bottleneck which can slow your application and cause frustration to your users.
Just like the monitoring, autoscaling is also provided by the controller implementations.
For example, if you are running the NGINX Ingress controller, you can configure autoscaling via the KEDA autoscaler that consumes the nginx metrics.
This object configures KEDA to autoscale the NGINX Pods if the average connections for a minute are more than 100.
apiVersion: keda.sh/v1alpha1
kind: ScaledObject
metadata:
 name: nginx-scale
spec:
 scaleTargetRef:
   kind: Deployment
   name: main-nginx-ingress
minReplicaCount: 1
maxReplicaCount: 20
cooldownPeriod: 30
pollingInterval: 1
triggers:
- type: prometheus
   metadata:
     serverAddress: http://prometheus-server
     metricName: nginx_connections_active_keda
     query: |
       sum(avg_over_time(nginx_ingress_nginx_connections_active{app="main-nginx-ingress"}[1m]))
     threshold: "100"
Resource sharing
Kubernetes runs multiple workloads (Pods) on the same physical/virtual Node. This means that these workloads will share the underlying host resources.
Kubernetes provides two constructs to control how these resources are shared - resource limits and resource requests.
We discussed resource limits in Part 2 of this series, but now I will go into more detail about the limits and requests and the difference between the two.
The requests show how many minimum resources the workload will need. The kubelet will use this information to find a proper Node to schedule the Pod (one with at least that many resources as the requests for the Pod). A Pod can go under or over the requested resources.
The limits show how many maximum resources the workload will need. Kubernetes will not allow a resource to use more than its limits. This limit is enforced by the container runtime, and a resource will not be allowed to exceed it.
Dynamic StorageClass provisioning
When you create a Volume in Kubernetes, you specify its StorageClass.
The StorageClass shows some properties of the volume, e.g., its quality-of-service levels, its backup policies, or other policies determined by the cluster administrator.
You are not limited to the number of StorageClasses you can use, and you can even define your own StorageClasses by creating a new Kubernetes resource of that type.
This is a sample StorageClass:
apiVersion: storage.k8s.io/v1
kind: StorageClass
provisioner: kubernetes.io/aws-ebs
metadata:
  name: standard
reclaimPolicy: Retain
allowVolumeExpansion: true
volumeBindingMode: Immediate
parameters:
  type: gp2
mountOptions:
  - debug
From its properties, we see that volumes from this class are provisioned by AWS EBS; it has the GP2 type, reclaim policy of Retain, etc.
The parameters depend on the provisioner, e.g., AWS EBS has one set of parameters that make sense for this provisioner, GCE PD has other parameters, and so on.
Summary
This is all for part five.
In the last two article, we managed to demystify the biggest tier of the iceberg. The next ones are smaller, but are getting more and more specific. I don’t know about you, but I can’t wait to dive into them.
The series continues with Part 6.
If you don’t want to miss it, you can follow me on Twitter or LinkedIn.