Demystifying the Kubernetes Iceberg: Part 3
Categories:
11 minute read
This is the third article of the “Demystifying the Kubernetes Iceberg” series. My goal for this series is to explain all concepts mentioned in the “Kubernetes Iceberg” meme by Flant.
You can find the first article here and the second one - here. I will publish one article each week until I complete the whole iceberg.
And this is the iceberg itself:
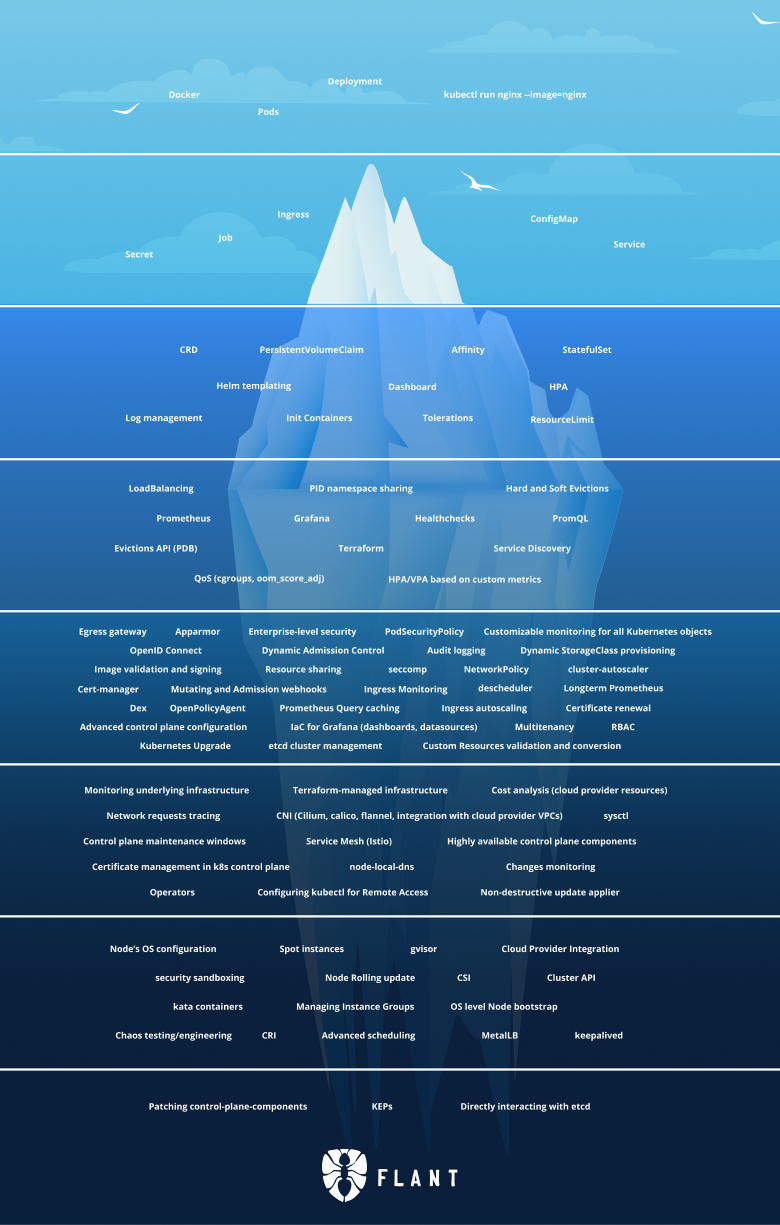
In this article, I focus on Tier 4 of the Iceberg. Let’s go!
Tier 4
Load Balancing
Load Balancing as a concept means that you have multiple instances of a given workload, but you don’t access them directly. Instead, you access a load balancer/gateway/reverse proxy that decides which instance of your workload to call.
In Kubernetes, the same concept can be applied to Pods and Services.
In Tier 1, I explained how Services provide stable IP and networking to Pods that are ephemeral and can be replaced with other Pods (with different IPs) at any given time.
Services also provide Load Balancing between these Pods. A Service that represents 3 Pods will route traffic to these pods on a round-robin basis.
Service Discovery
Service Discovery is the way services in a micro-services architecture discover one another.
Outside of Kubernetes, a popular tool for service discovery is Eureka. It allows services to register themselves and serves as a centralized service registry.
Kubernetes makes service discovery in a slightly different way.
As we already mentioned, the construct that gives workloads stable IPs is Services.
When you create a Service, it gets a stable IP and a domain name that is valid inside the Kubernetes cluster.
All workloads running in that cluster can access that Service(and the Pods behind it) by its IP OR domain name.
PID namespace sharing
When running containers, they share the host Kernel, but at the same time, they are isolated from one another via cgroups and namespaces. PID Namespaces mean “Process ID Namespaces.” Each container has its own process namespaces, which means that one container cannot see the processes run by another container (even though they are running on the same host).
The same applies when running multiple containers in a Pod - they are isolated on the namespace level and do not see each other’s processes.
However, Kubernetes gives you the capability to make containers in the same Pod share the process namespaces (hence be able to see each other’s processes).
This can be done via setting a simple flag in the Pod spec - shareProcessNamespace to true.
Sharing the process namespace has several use-cases. For example, if you are deploying a sidecar that needs to be tightly integrated with the main container. Or, for debugging purposes - you can deploy a workload container that is stripped out of all the debugging tools and then run a sidecar container that has all the utilities you need and make them share the process namespace so that you can use the second container to debug the first one.
Hard and Soft Evictions
Evictions in Kubernetes mean that the kube-scheduler has removed a Pod from a Node.
This can happen because the Node has gone over capacity on CPU, disk, or memory.
When starting the kube-scheduler, you can configure hard and soft eviction thresholds, which will tell Kubernetes under what conditions to perform the evictions.
Soft Evictions
Soft evictions mean that Kubernetes will give the Pods some grace period before terminating them.
That period is configured via the eviction-soft-grace-period and eviction-max-pod-grace-period flags.
The conditions under which a soft eviction is done are configured via the eviction-soft property.
For example, memory.available<1.5Gi value for the eviction-soft configuration means that Kubernetes will perform a soft eviction of a Pod if the available memory of a Node goes below 1.5 GB.
Hard Evictions
Hard evictions mean that Kubernetes will instantly terminate the Pods without any grace period. This is meant to happen in extreme cases where the Node’s resources are at such a low level that something must be done immediately; otherwise, the whole Node will fail.
The conditions under which a hard eviction is done are configured via the eviction-hard property.
Evictions API (PDB)
Apart from the kube-scheduler performing an eviction based on some conditions, you can also evict a pod manually by calling the Evictions API.
Doing this is as simple as POST-ing an Eviction object to your Kube API Server:
curl -v -H 'Content-type: application/json' https://<KUBE_API_SERVER>/api/v1/namespaces/default/pods/<POD_NAME>/eviction -d @eviction.json
where evictions.json contains the Eviction object:
{
  "apiVersion": "policy/v1",
  "kind": "Eviction",
  "metadata": {
    "name": "<POD_NAME>",
    "namespace": "<NAMESPACE_NAME>"
  }
}
or you can apply this YAML object via kubectl:
kubectl apply -f eviction.yaml
Where eviction.yaml contains the Eviction object:
apiVersion: policy/v1
kind: Eviction
metadata:
  name: <POD_NAME>
  namespace: <NAMESPACE_NAME>
Another alternative is to use kubectl drain command, which will do the same, or kubectl delete Pod <POD_NAME> -n <NAMESPACE_NAME>.
In all these examples, <POD_NAME> represents the name of the Pod you want to evict, and <NAMESPACE_NAME> is the namespace in which this Pod lives.
All of them will result in the same thing: the Pod being evicted from the Node.
Prometheus
Prometheus is an open-source monitoring and alerting toolkit. Built originally in SoundCloud, it is now under the hat of the CNCF (Cloud Native Computing Foundation).
It allows metrics collection via a pull model over HTTP.
There are various adapters that allow you to collect different types of metrics without doing much work by installing the adaptor and configuring it. There are also libraries for various programming languages that will enable you to collect custom metrics in your application without writing much code.
Prometheus has become the de-facto standard for metric collections, and you can use it to monitor your application running and Kubernetes AND your Kubernetes clusters themselves.
To visualize that data, you can use …
Grafana
Grafana is an open-source tool for visualizing data. It allows you to build a custom dashboard for every time of metric you have.
It supports data from multiple sources, including Prometheus, MySQL, PostgreSQL, etc.
You can deploy it and manage it yourself or use the SaaS offering by Grafana at https://grafana.com/.
PromQL
PromQL stands for Prometheus Query Language. It is a structured query language that allows you to select and aggregate time-series data stored in Prometheus in real-time.
The simplest PQL expression would be something like:
http_requests_total
This expression will return all-time series data for the http_requests_total metric.
If you want to filter by job and handler labels, you can extend the query like this:
http_requests_total{job="apiserver", handler="/api/comments"}
The language supports many complex expressions and functions like rate, sum by, etc.
For complete language reference, check the docs and examples.
Health checks
A health check is an action that is performed to determine whether a given Pod is healthy and can service requests.
When creating a Pod, you can define “probes,” e.g., actions that Kubernetes will execute to determine the application’s state.
There are three types of probes:
Startup probes
A startup probe is defined to indicate Kubernetes when the application has started.
All other probes are disabled until the startup probes have been executed successfully.
Defined via the spec.startupProbe field in the Pod spec.
Liveness probes
A liveness probe indicates whether the container is healthy. If not, it will be restarted.
A liveness probe is configured via the spec.livenessProbe field in the Pod spec.
There are a few types of liveness probes - HTTP(livenessProbe.httpGet), TCP (livenessProbe.tcpSocket), gRPC (livenessProbe.grpc) or command (livenessProbe.exec).
Kubernetes will perform the action defined in the liveness probe (for example, make an HTTP GET request to an endpoint) to determine whether the application is healthy.
If a few consecutive liveness probes fail, Kubernetes will consider the Pod not healthy and restart it.
The number of probes needed to fail before Kubernetes does that is configured via the livenessProbe.failureThreshold field.
There are other specifics to these probes like:
- if a startup probe is defined, Kubernetes will wait for that to succeed before starting to try to liveness probe. Otherwise, there is the possibility that Kubernetes will be restarting Pods that have not even started because of failing liveness probes.
- You can also configure how often Kubernetes will check the liveness probe via the
periodSecondsproperty. - You can configure how much time after the container has started to wait before calling the probes via the
initialDelaySecondsproperty.
For full API reference of the probes, check the API docs.
Readiness probes
Similar to liveness probes, but shows whether the Pod is ready to serve requests or not.
If a liveness probe fails, the Pod will be restarted. If a Readiness probe fails, the Pod will not be restarted but will be removed from the Service load balancer (so that it does not serve requests).
Defined via the spec.readinessProbe field in the Pod spec.
All configuration options for the liveness probe are also valid for the readiness probes.
Terraform
Terraform is an open-source tool that allows you to describe your infrastructure in Terraform files and create/update it via a simple command. This is the so-called IaC or Infrastructure as Code.
It supports multiple cloud providers via so-called Terraform providers. For example, you can use the AWS provider for AWS resources, the Azure provider for Azure resources, etc.
By doing this, you can manage your infrastructure in a centralized manner via the GitOps approach. You can keep your Terraform files in a git repo. Each time someone wants to make a change to your infrastructure (for example, create a new Kubernetes cluster or a new Virtual Machine), they need to make a change to the Terraform files, commit that, and open a Pull Requests, get that reviewed and approved and merge it. Once merged, the CI/CD pipelines will take care of running the Terraform command that will create the new resources.
Not using such solutions would mean that someone needs to manually go and use the cloud provider UI to create new resources. This has many drawbacks. For example:
- you have to do this once for each environment you have. e.g., if you have dev, test, and prod environments, you would have to do this action three times, once for each environment. With Terraform, you can reuse one set of files for one environment.
- The person that does this cannot get his work verified by a team member in an easy way. e.g., how do you make sure that the person doing this would create the right resources? With Terraform and GitOps, all changes are reviewed before merging to the main branch and applied.
- Without Terraform, you have no easy way of tracking ALL of your infrastructures. This can be a problem if you have three environments but want to create a 4th one. How do you ensure you have not missed creating some resources in the new environment? You can’t. You don’t have that problem with Terraform because your whole environment is described in the Terraform files.
Other IaC projects provide alternatives to Terraform. These include, but are not limited to Pulumi, AWS Cloud Formations (only for AWS resources), Azure Resource Templates (only for Azure resources), and so on.
QoS (cgroups, oom_score_adj)
QoS stands for Quality of Service.
In Kubernetes, QoS classes are a property that Kubernetes will assign to your Pods depending on their resource limits configuration.
The QoS classes are:
Guaranteed
The Guaranteed QoS class is assigned to Pods that satisfy these conditions:
- Every Container in the Pod has a memory limit and a memory request
- For every container in the Pod, the memory limit is equal to the memory request.
- Every Container in the Pod has a CPU limit and a CPU request.
- For every container in the Pod, the CPU limit is equal to the CPU request.
Burstable
The Burstable QoS class is assigned to Pods that do not satisfy the conditions for Guaranteed but satisfy this condition:
- At least one container in the Pod has a memory or CPU request or limit
BestEffort
The BestEffort QoS class is assigned to Pods whose containers don’t have any memory or CPU limits or requests.
HPA/VPA based on custom metrics
In the last article, I explained what HPA is and how to do it with Kubernetes-defined metrics.
Another thing you can do is define your custom metrics, which can be used by the HPA to determine when you scale out/in.
This is enabled by tools like the metrics-server that expose custom metrics to the Metrics API. These metrics are then used by the HPA (which is configured to look at them) to determine whether a workload needs scaling.
Apart from the HorizontalPodAutoscaler which we talked about in the last article, there is also the Vertical Pod Autoscaler. Vertical scaling means that instead of creating new instances of our workloads, we increase the resources of our existing ones (e.g. we provide more memory, CPU, and disk).
With VPA you don’t need to set resource limits to your workloads, instead, the VPA will set them and adjust them accordingly.
The VPA also supports custom metrics.
Summary
This is all for part three.
With this article we already go into a deep territory and into concepts which you don’t necessary use on a day-to-day basis. I hope these articles are useful to you and you are learning something new. I definitely am while working on them!
The series continues with Part 4.
If you don’t want to miss it, you can follow me on Twitter or LinkedIn.